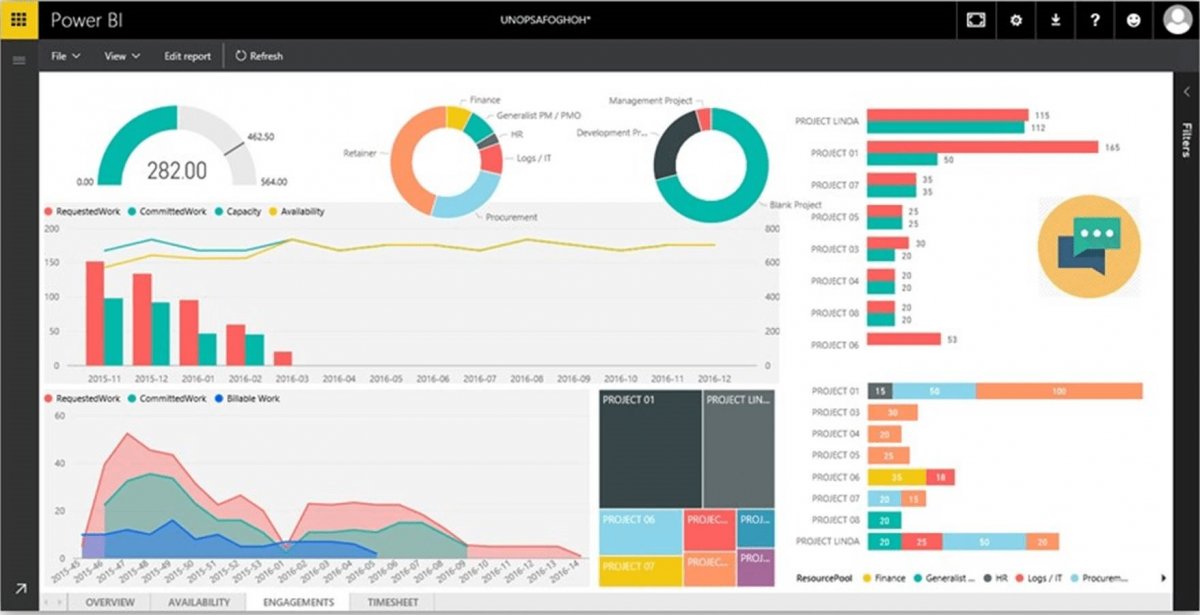
Displaying Microsoft Power BI on screens around your business is a common use case
VuePilot provides a Power BI app that makes displaying your reports on big screens around the office extremely simple.
You can create a new app for each different report you wish to display and give them a name such as “Sales & Marketing Reports“. You can then assign these apps to your screens that are managed by VuePilot using the online dashboard, which makes managing & updating displayed reports incredibly simple.
Please Note – This guide is for displaying Power BI Reports, which is slightly different to displaying Power BI dashboards, please see our guide here for displaying Power BI dashboards
Power BI apps can be used with our Hijack feature, like any other app so you can immediately trigger a display to show a report with just a few clicks, perfect for meetings or high priority incidents where you need to pull attention to a report right away.
Follow these easy steps to get up and running
Step 1: Generate Power BI Report Embed URL
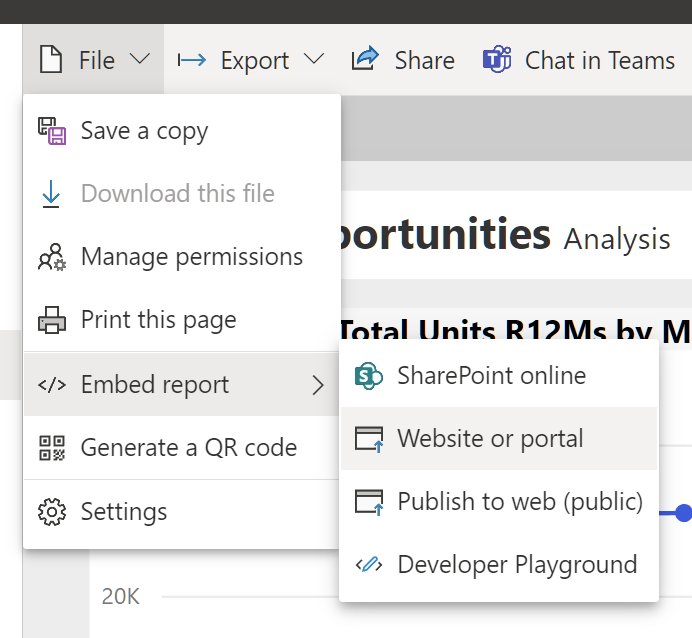
From your Power BI interface, when viewing the report you wish to display, click File then Embed Report then click Website or Portal
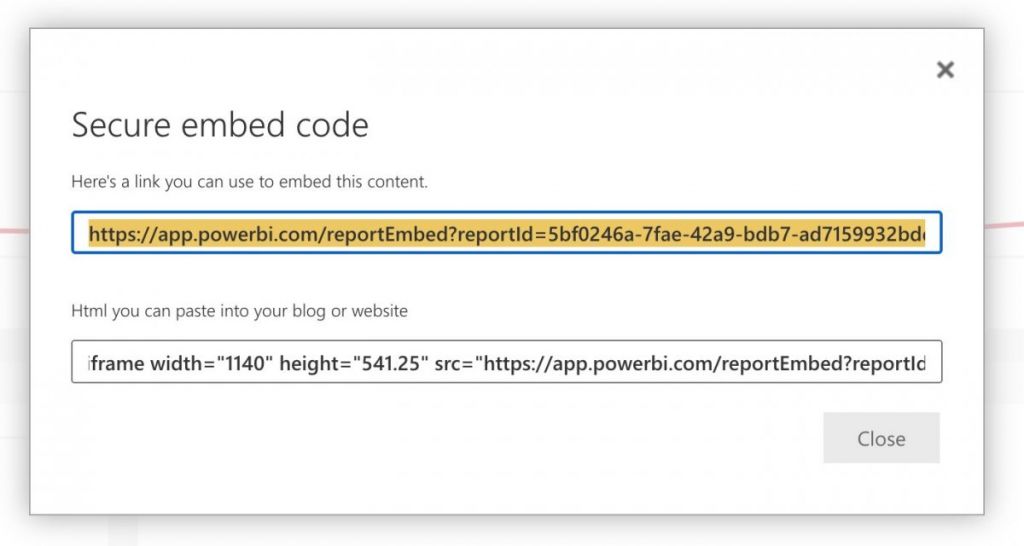
Next you will be presented with a window displaying the “Secure Embed Code“, copy the link from the upper box, we will be using this next
Step 2: Create Power BI App
Login to the VuePilot dashboard and click the Apps section from the sidebar.
Select Microsoft Power BI Report from the apps list
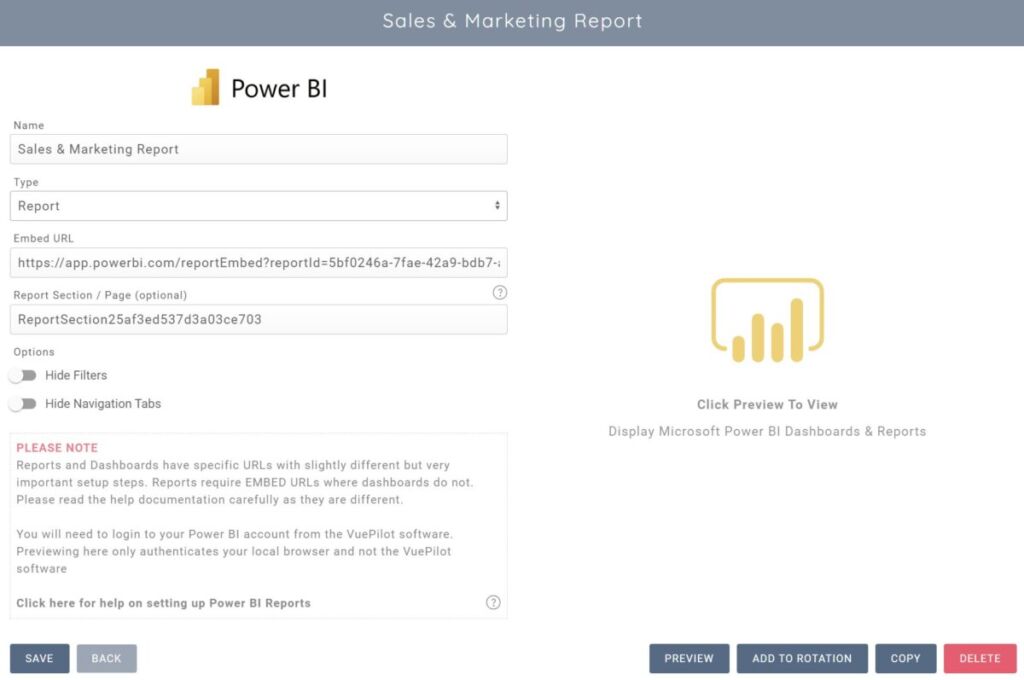
Give the report a name and then paste the embed URL into the “Embed URL” input box
Important: You must select the correct type, either Report or Dashboard, in this case, select Report. You cannot use a Dashboard URL in a Report app type or vice versa.
You can optionally enable a filters panel and a report navigation bar on your Power BI report by checking the “Show Filters” and “Show Navigation Tabs” buttons. These controls are useful if you wish to interact with the report
Showing Specific Report Pages / Tabs
If your report has multiple pages or tabs, you may wish to jump directly to one of those tabs. You can do this by using Report Section configuration option on the app interface.
You will need to copy the ReportSection URL parameter from your Power BI interface when viewing your report, it will be at the end of the URL and it will change when you click into different pages or tabs.
It will look something like ReportSection462547275
Please Note
Some reports may only show an ID without the “ReportSection” word. You can still use this ID, it will be the final part of the URL.
For example: https://app.powerbi.com/groups/me/reports/aaaaaaa-1111111-eeeeee-bbbbb/63e5b5d432030d589abd
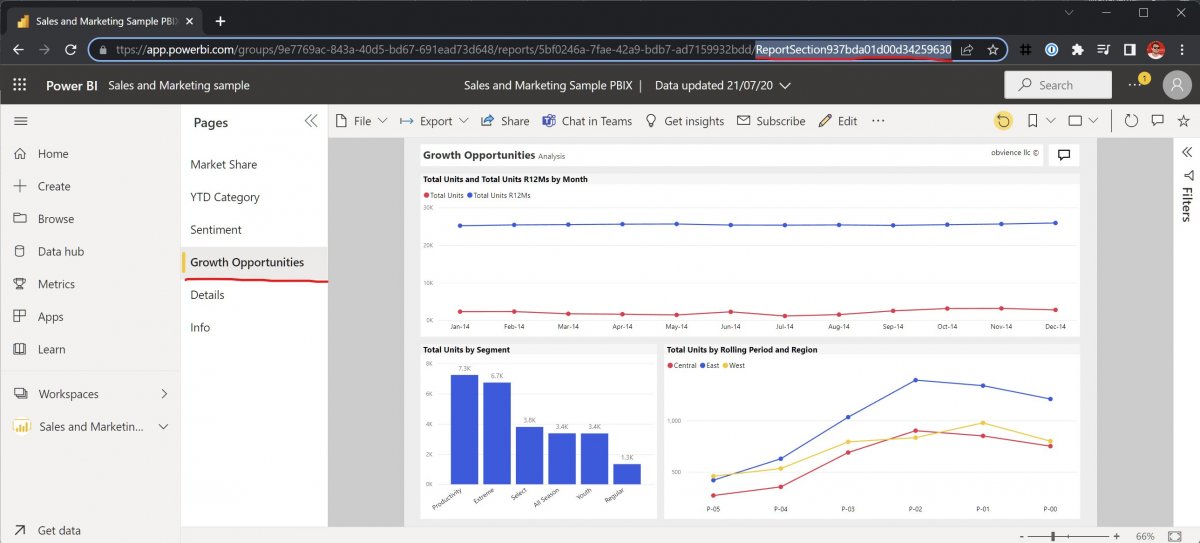
Once you have this, simply paste this parameter into the ReportSection input box on the app report configuration.

For more information see the Microsoft Documentation for how to get the specific report section from the dashboard view: Set Which Page Opens For An Embedded Report
Filtering Data
You can filter your report data by appending filtering strings to the embed URL, see: https://docs.microsoft.com/en-us/power-bi/collaborate-share/service-url-filters
At this point you can click the “Preview” button to preview the report.
*Please Note* You will be presented with a login page which will authenticate your local browser to the Power BI report, however you must also login to the report on the VuePilot software as the authentication cookie will be stored on the local machine. We will cover this shortly.
Step 3: Assign The App To A Rotation
Now simply click the “Add To Rotation” button and select the rotations you wish to display the report in. The rotations are assigned to the screens in your office that are being controlled by the VuePilot player software.
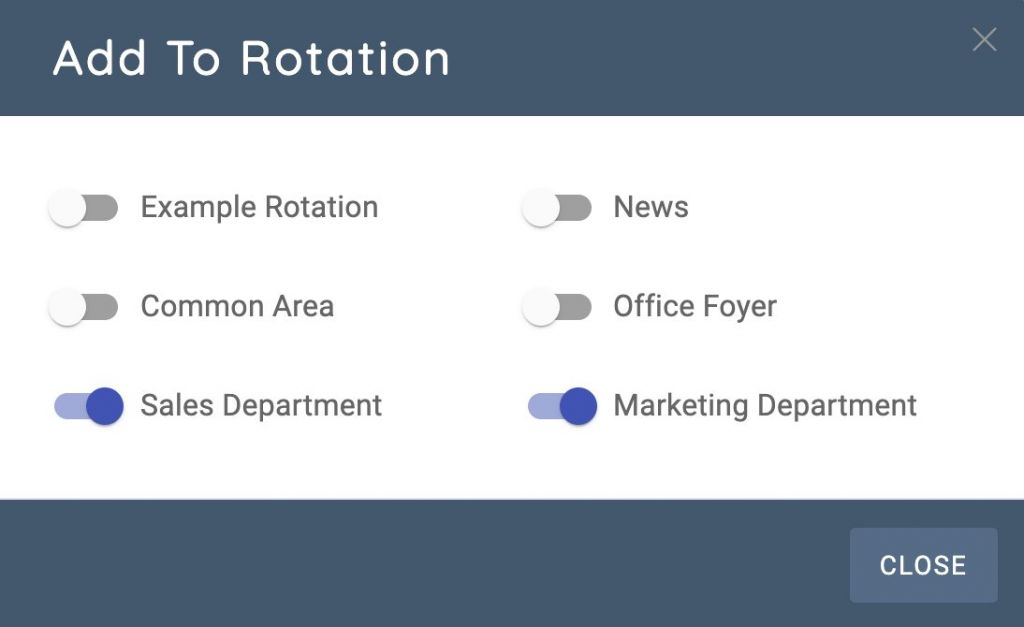
Within the next rotation, your report will begin appearing on the screens displaying these rotations
Step 4: Authenticate The VuePilot Players
As we mentioned earlier, when you login to the Power BI report, the local machine stores the authentication cookie, so we need to also authenticate the VuePilot players installed on your devices.
We can do this, from the VuePilot Player software by simply viewing the rotation, from the “Rotations” panel and then clicking the “Preview” button next on our Power BI Report row (the screen icon).
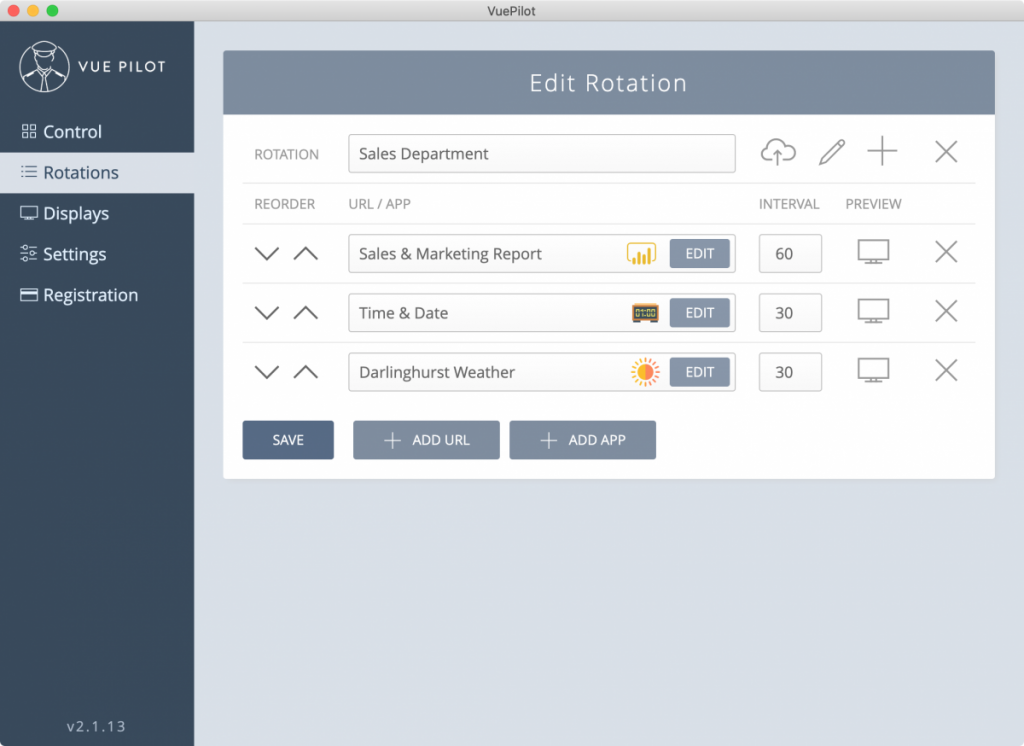
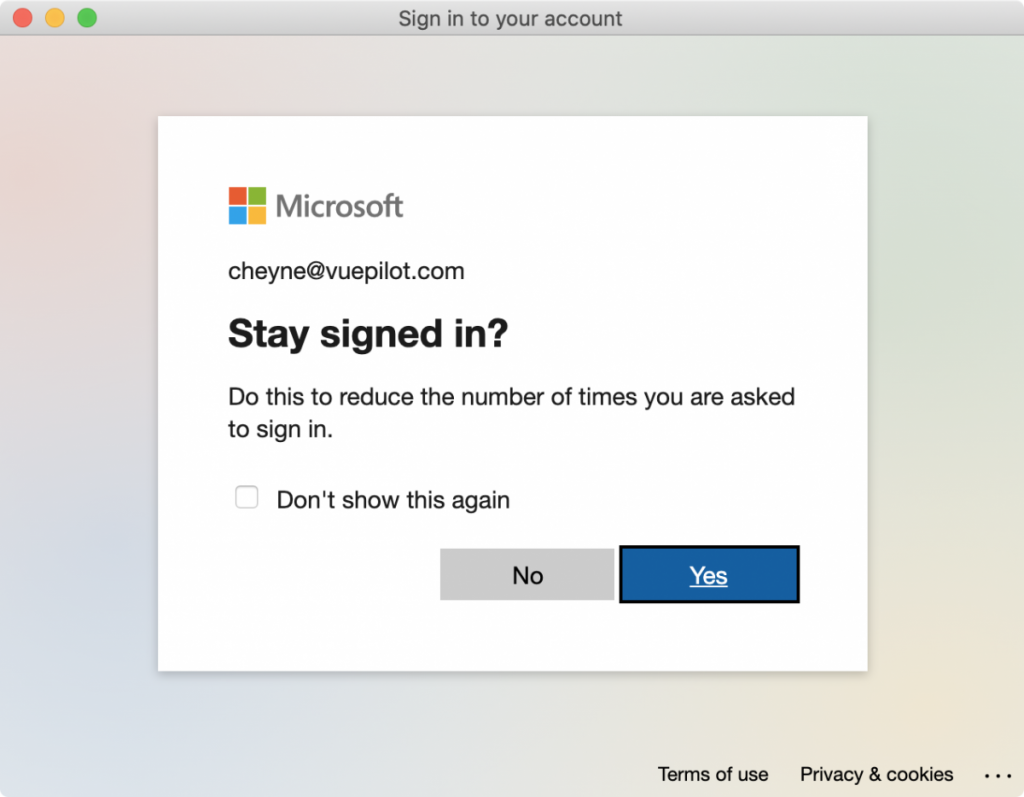
This will open the report in a new window and present you with the Microsoft Login screen.
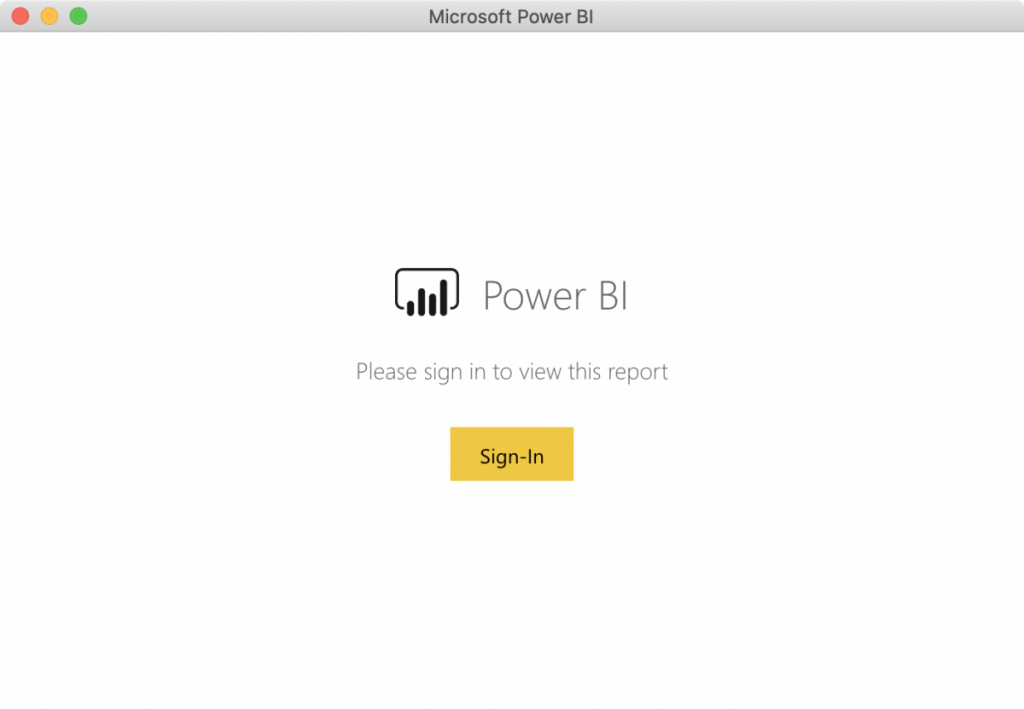
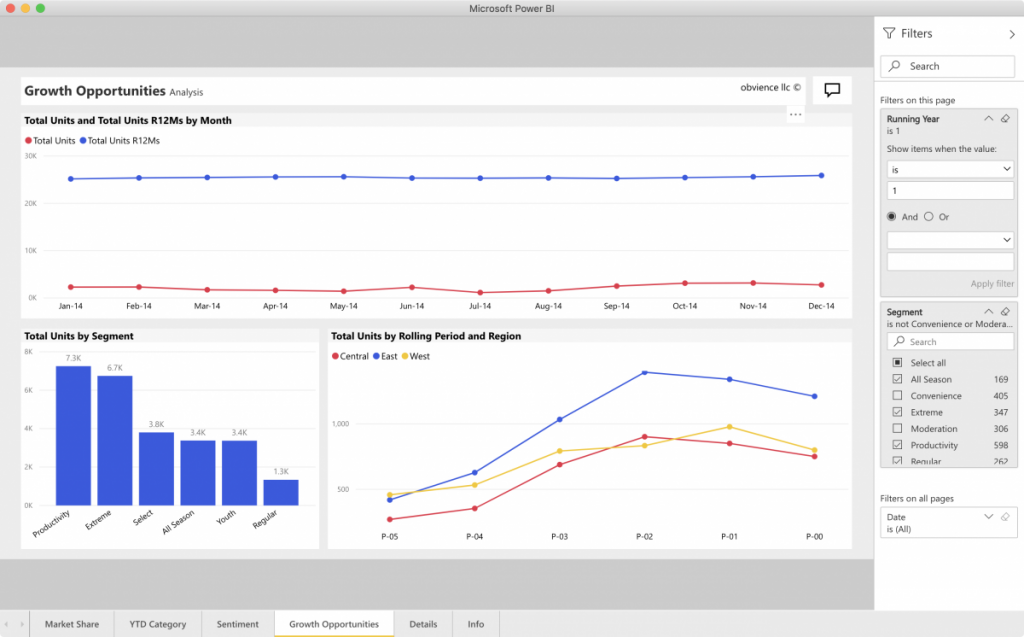
Simply login to the report as normal, and once you see the report content appear, you can close this window as this VuePilot Player is now authenticated and will be authenticated during normal rotations.
*Please Note* Be sure to to click YES when prompted if you would like to stay signed in to Microsoft, also check the “Don’t show this again” box. This will allow us to continue displaying reports without you needing to frequently re-authenticate
You can now preview, view and remotely manage your reports with VuePilot. Click the preview button again to test
Repeat this process for any additional players.
Regarding Session Expiry
If you are experiencing session logouts more frequently then you would like you may need to configure your organisations refresh tokens expiration limits.
Please see this article for more information https://www.vuepilot.com/support/article/microsoft-power-bi-authentication-information/
Troubleshooting Power BI App Issues
Please see our guide for troubleshooting app issues here: https://www.vuepilot.com/support/article/troubleshooting-microsoft-power-bi-issues/

